Nottingham’s Hidden River: Why the Trent Still Divides the City
Most people think Nottingham’s story is written by its city centre.
The castle, the universities and the growing business district dominate perceptions of the city. But when you begin looking at postcode-level data, another influence becomes impossible to ignore.
The River Trent.
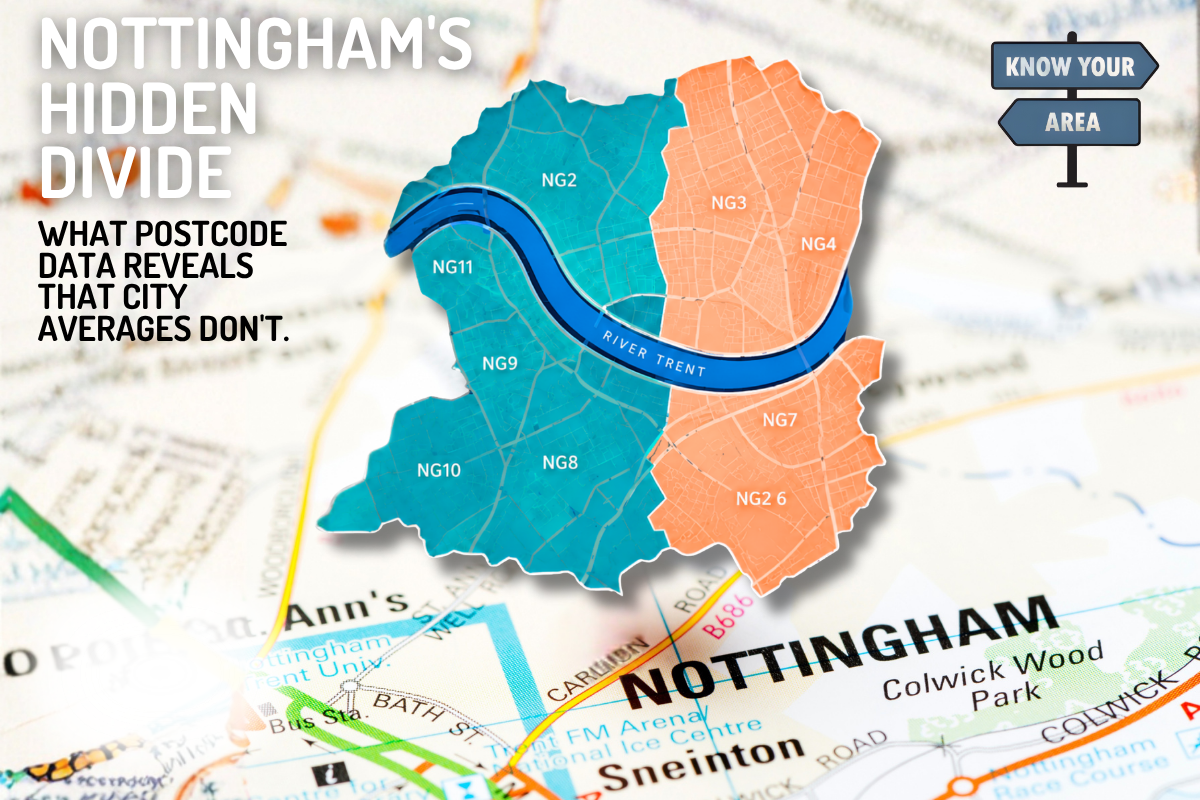
For centuries, the Trent has shaped trade, transport, industry and housing development across Nottingham. Today, its influence can still be seen in deprivation patterns, employment levels and demographic data. Using Know Your Area’s deprivation filters and Spotlight tools, a clear pattern emerges: what we call the River Trent Divide.
A city split by more than water
At first glance, Nottingham appears relatively compact.
However, when deprivation scores are mapped across the city, significant differences emerge between neighbourhoods. Some areas consistently rank among the least deprived in the region, while others continue to face long-term social and economic challenges.
The River Trent often acts as a visible marker in this pattern.
This does not mean every neighbourhood north or south of the river fits neatly into a category. Cities are always more complicated than that. But the data shows distinct geographical trends that home movers, investors and families should understand.
What is deprivation data?
The Index of Multiple Deprivation (IMD) is one of the most useful ways of understanding an area beyond property prices.
Rather than measuring a single factor, it combines information about:
- Income
- Employment
- Education
- Health
- Crime
- Housing access
- Living environment
Together, these create an overall deprivation score for small local areas.
For anyone researching where to live, this provides a much more complete picture than house prices alone.
Nottingham’s hidden statistical problem
Nottingham also demonstrates something urban researchers call the “under-bounded city” effect.
Unlike many English cities, Nottingham’s official city boundary excludes a number of affluent suburbs and commuter settlements that people commonly associate with Nottingham.
As a result, city-wide statistics can sometimes make Nottingham appear more deprived than the wider urban area actually is.
This is why postcode-level analysis matters.
Broad city averages rarely tell the whole story.
Why this matters for movers
Most property websites focus on the house. Know Your Area focuses on the area.
Two homes may have similar prices, similar schools and similar commuting times. Yet the surrounding postcode data can tell very different stories.
Understanding deprivation patterns can help identify:
- Areas undergoing regeneration
- Locations attracting investment
- Hidden contrasts between neighbouring communities
- Places changing faster than their reputation suggests
For buyers planning a long-term move, these factors matter.
See the River Trent Divide for yourself
The River Trent Divide is one of Nottingham’s clearest examples of how geography continues to shape opportunity.
Using KYA’s Spotlight tools, you can explore deprivation scores, demographic trends and postcode comparisons across the city.
The result is a far more detailed understanding of Nottingham than city-wide statistics alone can provide.
Explore the Nottingham Spotlight filters today and discover what the postcode data reveals before you move.
Because understanding the area is just as important as finding the house.