Below are some easy ways to use the maps, and make the most of their power
Making the most of our map
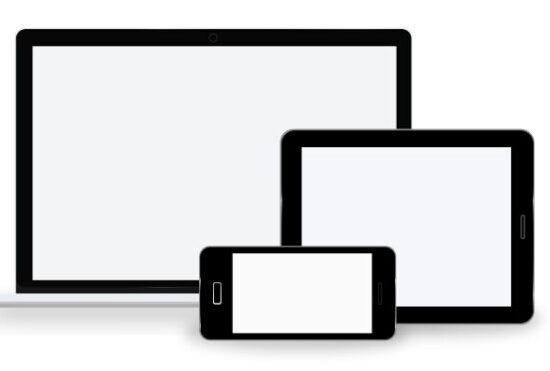
What devices do we support?
Our maps work across most platforms.
- They display well on all computers, whether these are Windows computers, Mac’s, Chromebooks or other platforms (linux, Android). There is a lot of information on offer. The larger the screen, the better.
- They display well on tablets, both iPads, Galaxy Tab’s, Android tablets, or Chromebooks with detachable keyboards.
- Phones are supported, both iPhones, Galaxy smartphones, and all Android phones. Please bear in mind: There is a lot of information to pack into a small space. Most of the popups containing detailed information take up most of the space on the screen, and make it difficult to see the map underneath. It looks far better if the phone is tilted sideways into landscape mode. Also, some phone platforms seem to ignore brief tappings on the screen. If the phone doesn’t seem to respond, hold the finger down on the screen for longer.
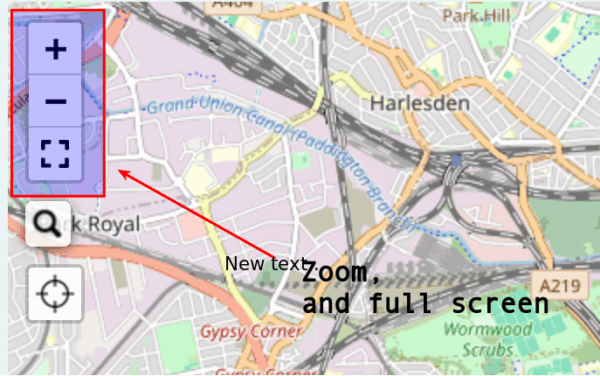
Zoom and full screen
At the top left of the map are the zoom and full screen controls.
- The square icon makes the map enlarge to take up the entire screen on your computer, tablet or phone. Whilst you are in full screen mode, the square icon changes shape to a large cross. Pressing the cross button takes you out of full screen mode.
- The ‘+’ button allows you to zoom in on the map
- The ‘-‘ button allows you to zoom out on the map
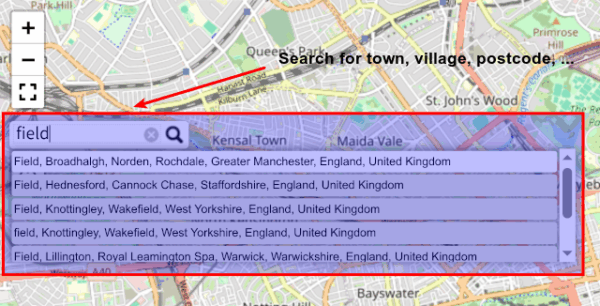
Search
The magnifying glass at the top left of the map allows you to search for any place, village, or postcode in England (the rest of the UK coming shortly). The best matches for the name you type are shown as you search. Clicking on any of the choices will move the map to the selected location.
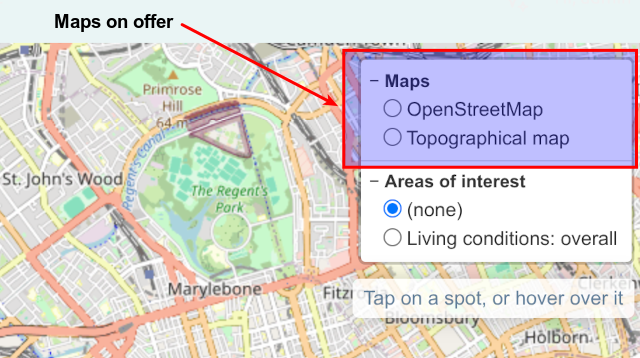
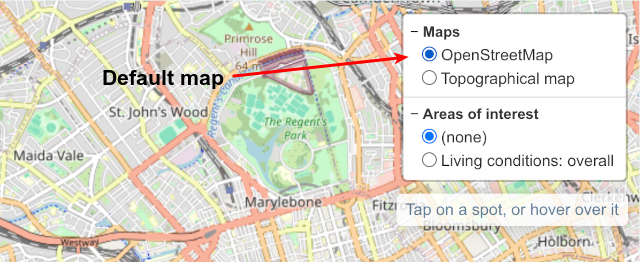
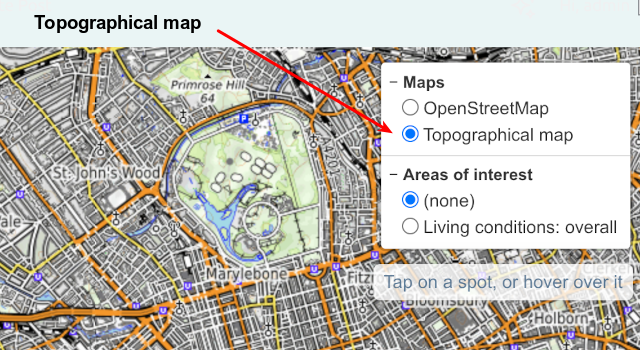
Choosing base maps
The multiple squares icon at the top right allows you to choose both the base map, and any overlays.
We offer two base maps:
- A topographical map focusing on roads and buildings.
- A default street map keeping a balance between man-made structures and green space
Types of overlays
Our groundbreaking maps have two different types of overlays:
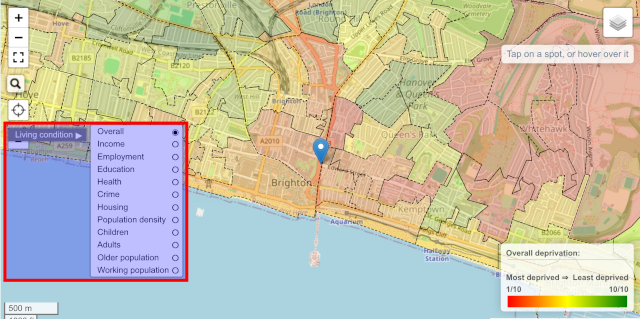
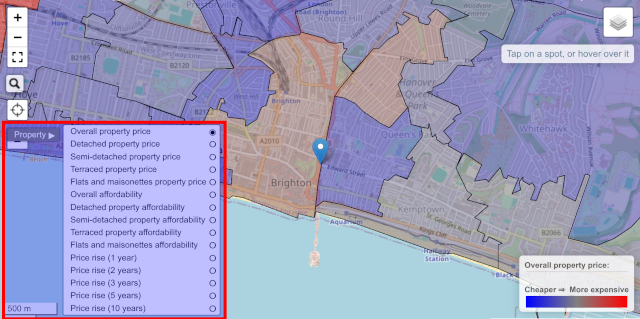
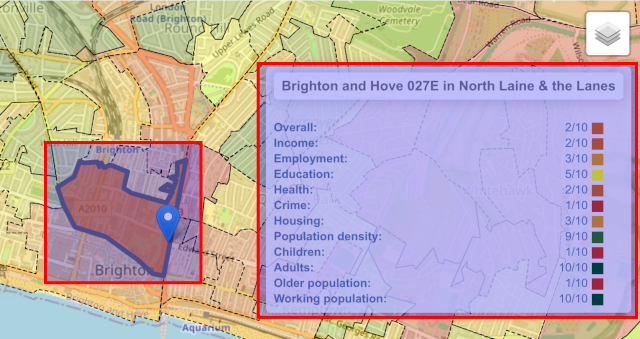
- Areas of interest: These are geographical areas that each share one fact, like a property price, the deprivation statistics, the crime statistics, the flood risk, the radon gas level, or the member of parliament. Each one of these are coloured and overlaid on top of the map. Only one of these can be active at a time – activating several of these at the same time makes for a very messy set of colours!
- Points of interest: These are a set of points overlaid on the map. Each point represents one item tied to a location. Each point can represent for instance a school, a doctor’s surgery, a hospital, a prison, a power station, a wind farm, and a number of others. Several of these overlays can be active at the same time.
We have separate maps for each type of statistic, each containing one set of data. For our members, we offer maps where multiple layers can be viewed on the same map at the same time.
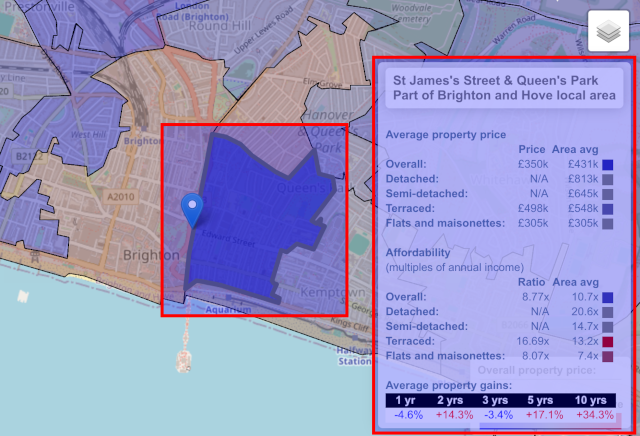
Highlighting a single area or spot
You can highlight a single area or spot on the map to view all the detailed information that we hold. Highlighting can be done in a couple of ways:
- It is impossible to use a ‘cursor’ when you use a tablet or mobile phone. Instead, pressing your finger on an area (or long pressing on some types of mobile phones) will highlight the information under the finger. The same logic for re-selecting and unfreezing the entry works as described above.
- When the map is viewed on a laptop, each area and spot is brought up automatically when the mouse pointer is inside or on the spot (‘free flow’). You can also click on the area or spot, and the information is frozen on the screen when the cursor moves elsewhere. Clicking on a new spot will change the focus on a new area. Clicking on the same spot will unfreeze the information, and the screen goes back to ‘free flow’.
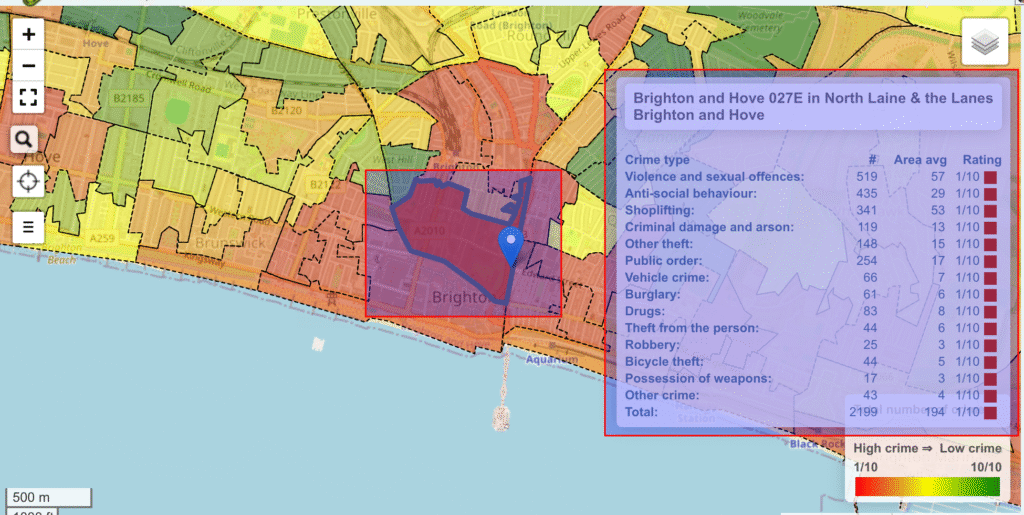
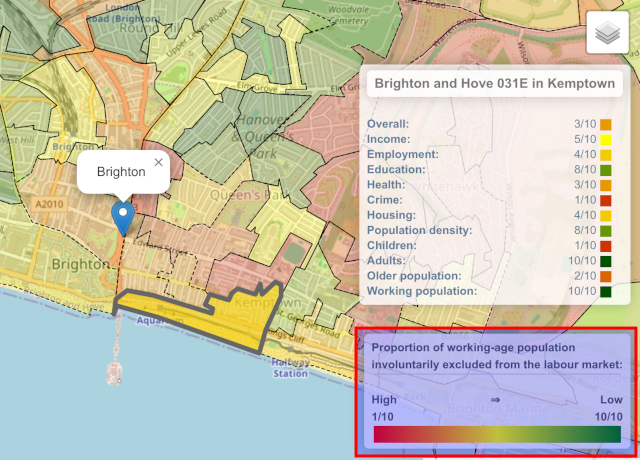
Explanations of the colouring
At the bottom right of the map, there is an explanation of the data that we use to colour the display, and the colours used.
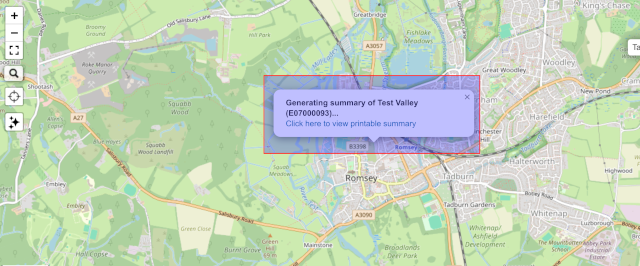
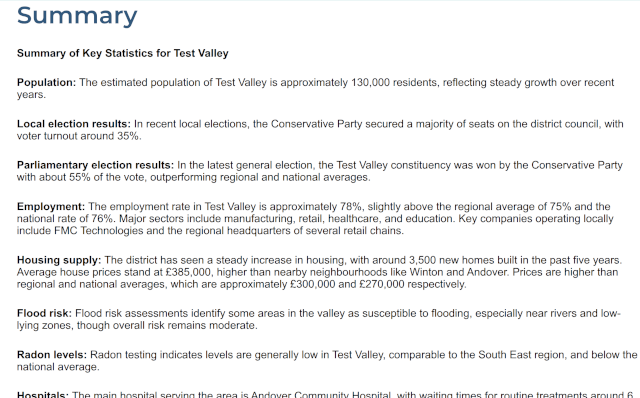
Generating summaries
For our premium members, we offer extra functionality where we can generate a written summary of any area. Underneath the crosshairs button, there is another button with a stars logo. Pressing this button will generate a popup window on the map, with a link to generate a summary. Pressing this link will take you to a separate page with a detailed summary of the area.